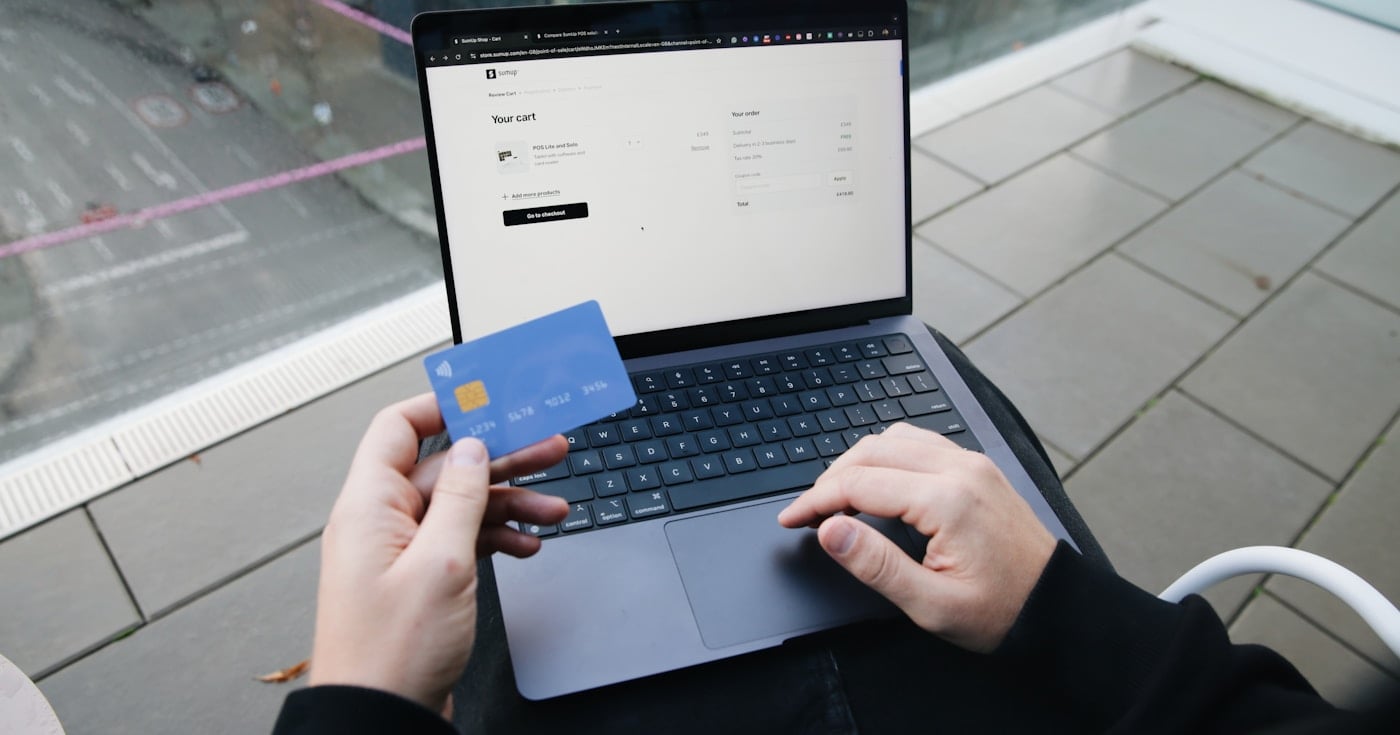
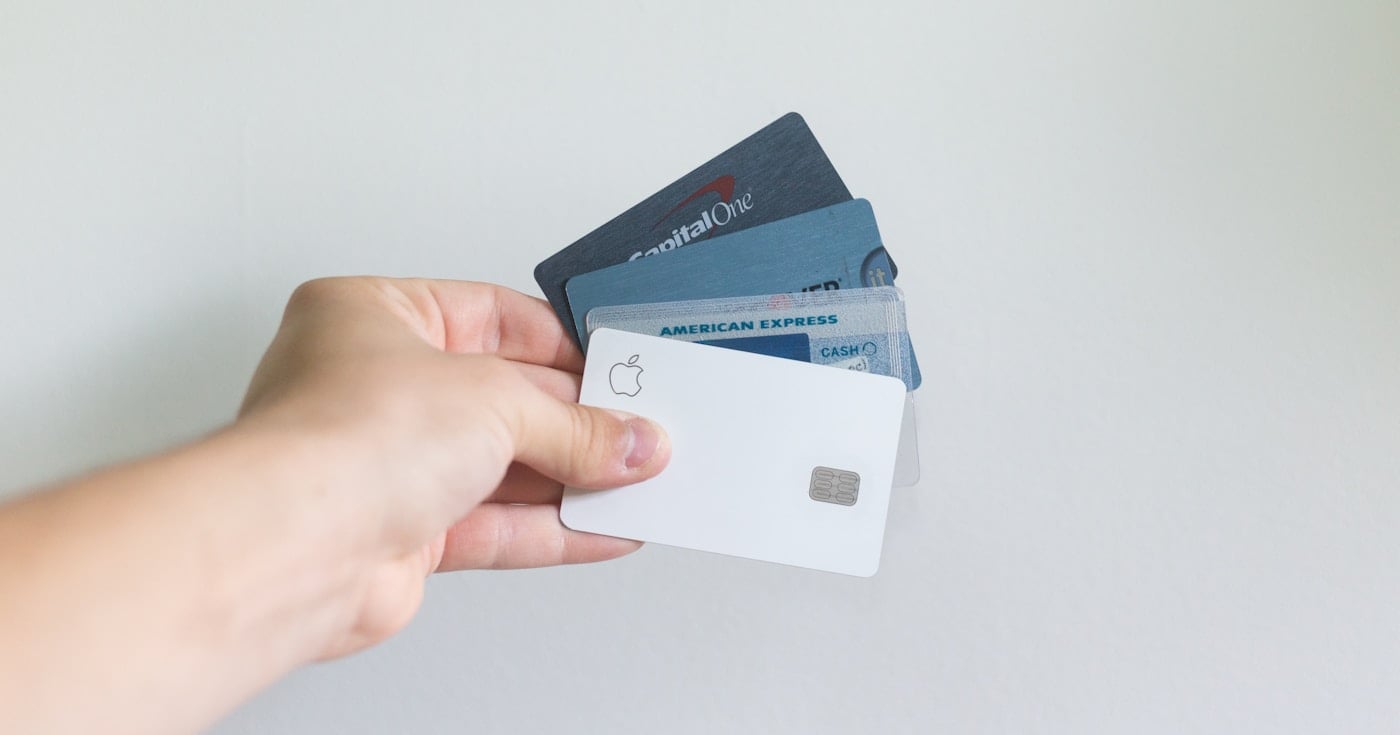
Buy Now Pay Later in 2026: 46 Statistics on Market Size, Adoption, and Risk
The most current buy now pay later statistics for 2026, organized by theme: market size, adoption, AOV uplift, default rates, providers, and regulation.
Read
Weekly pricing insights for founders and revenue teams.
Models, benchmarks, tools, and guidance for SaaS founders and product teams.
SubscribeThe most current buy now pay later statistics for 2026, organized by theme: market size, adoption, AOV uplift, default rates, providers, and regulation.

The all-in cost of a chargeback averages $191. This guide covers five reversal types, Visa VAMP 2025 thresholds, ACH return codes, and when to fight back.

Klarna wins for global merchants and high-frequency shoppers; Affirm wins for US merchants selling high-ticket items. Compare fees, credit impact, merchant economics, and strategic direction for 2026.
Apple Pay reaches over 85% of US retailers and cuts fraud by 42%. Google Wallet leads globally. Compare security, acceptance, privacy, and pricing.
Stripe's advertised 2.9% + $0.30 rate applies to US domestic card transactions with no add-ons. For global SaaS, effective rates run 4–7%. Here's the complete fee breakdown, negotiation playbook, and when to consider alternatives.

From $378B in GMV to 2.86M live stores, 47 Shopify statistics cover platform growth, market share, payments, merchant economics, and AI trends in 2026.
Chargeback management for SaaS in 2026: the five-layer defense stack, Visa VAMP thresholds, CE3.0 mechanics, and the representment metric vendors don't advertise.

BigCommerce posted its first GAAP profitable quarter in Q1 2026. Here are 44 statistics on revenue, active store counts, market share, and B2B enterprise growth.
47 chargeback statistics covering global volume, industry rates, merchant costs, friendly fraud patterns, win rates, card network thresholds, and prevention ROI for 2026.
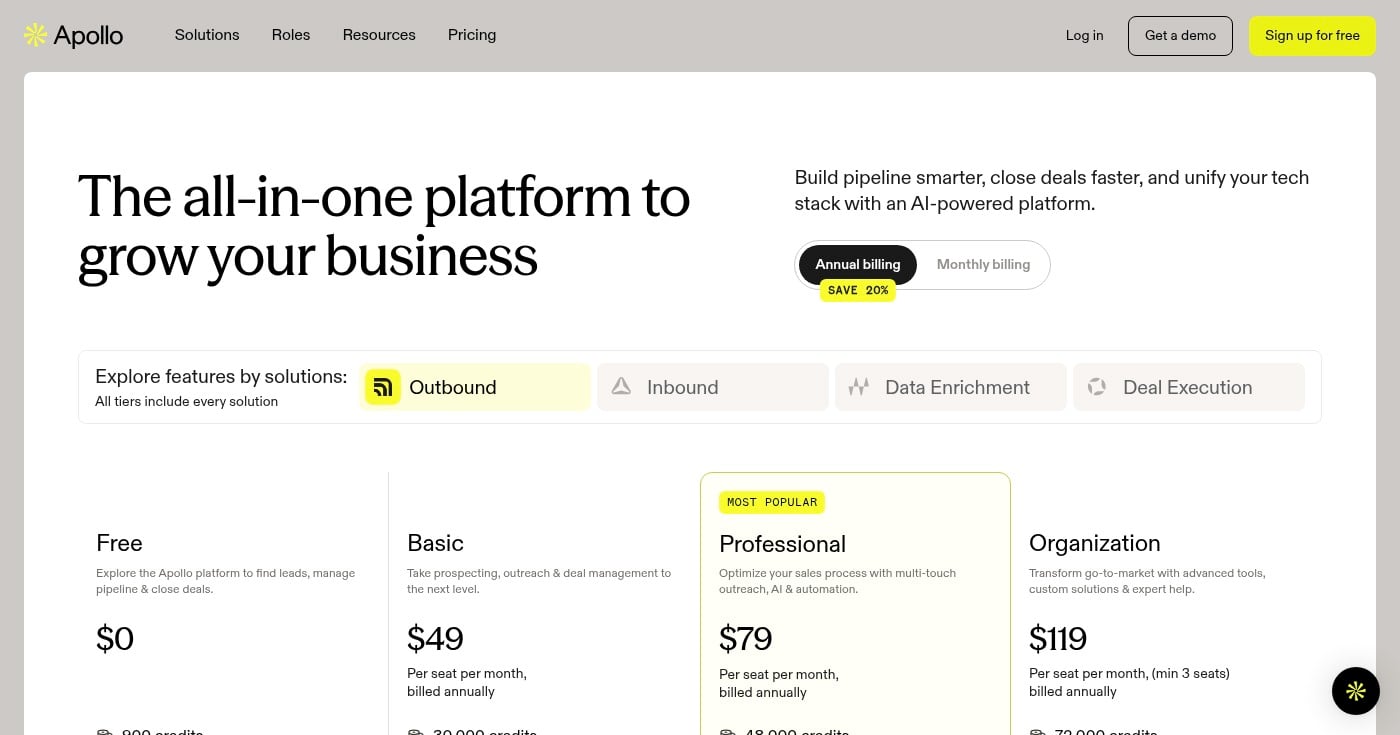
Apollo.io pricing starts at $49/seat/month (annual), but phone credit overages push real costs to $150-$400/user. Learn what each plan actually costs before you sign.
The most current buy now pay later statistics for 2026, organized by theme: market size, adoption, AOV uplift, default rates, providers, and regulation.
Apple Pay reaches over 85% of US retailers and cuts fraud by 42%. Google Wallet leads globally. Compare security, acceptance, privacy, and pricing.
From $378B in GMV to 2.86M live stores, 47 Shopify statistics cover platform growth, market share, payments, merchant economics, and AI trends in 2026.
BigCommerce posted its first GAAP profitable quarter in Q1 2026. Here are 44 statistics on revenue, active store counts, market share, and B2B enterprise growth.
47 chargeback statistics covering global volume, industry rates, merchant costs, friendly fraud patterns, win rates, card network thresholds, and prevention ROI for 2026.
Chargeback management for SaaS in 2026: the five-layer defense stack, Visa VAMP thresholds, CE3.0 mechanics, and the representment metric vendors don't advertise.
The all-in cost of a chargeback averages $191. This guide covers five reversal types, Visa VAMP 2025 thresholds, ACH return codes, and when to fight back.
Klarna wins for global merchants and high-frequency shoppers; Affirm wins for US merchants selling high-ticket items. Compare fees, credit impact, merchant economics, and strategic direction for 2026.
Stripe's advertised 2.9% + $0.30 rate applies to US domestic card transactions with no add-ons. For global SaaS, effective rates run 4–7%. Here's the complete fee breakdown, negotiation playbook, and when to consider alternatives.
Apollo.io pricing starts at $49/seat/month (annual), but phone credit overages push real costs to $150-$400/user. Learn what each plan actually costs before you sign.